Speaker array - measurements
Prepared on the basis of the results of research task No. II-41 carried out in 2021-2023 entitled "Research on acoustic field control on the example of a matrix sound source with controlled directional characteristics" financed by the Ministry of Education and Science from a subsidy for the maintenance and development of teaching and research potential.
The possibilities of controlling the distribution of the sound field are closely related to the directivity characteristics of sound sources. Sources with high directivity allow for appropriate determination of the sound field distribution. This distribution is consistent with the directivity characteristics of the source in the free field and differs from the directivity characteristics of the source, the more the area in which the source is located is similar to the reverberant field. In other words, in an anechoic chamber or open space, the distribution of the sound field is consistent with the directionality characteristics of the sound source, while in a reverberation chamber, the directionality characteristics do not affect the sound field distribution. Of course, the mentioned compliance concerns the relative difference in the sound pressure level for a specific distance from the sound source, because the sound pressure level decreases with the distance from the source.
The reasons presented above were the reason for using directional sound sources to provide specific amplification of large mass events taking place in open spaces or rooms with large volume (dimensions) and a high absorption coefficient of the surfaces limiting the interior.
The measurements performed as part of the statutory work were made in a room of the NF Department (Central Institute for Labour Protection), which is equipped with acoustic adaptation to reduce the impact of reflected waves on the measurement results. Hence, the distribution of the acoustic field is largely analogous to the directionality characteristics of the developed directional sound sources.
The measurements performed concerned mainly the linear source and the first version of the directional matrix. In the case of the directional matrix in the second version, the scope was limited to measuring the family of directional characteristics as a function of frequency and one variant related to the modification of the number of active transducers. It was assumed that this matrix, due to the use of ready-made factory elements, has fewer possibilities of modifying its parameters than the first two mentioned directional sources and its construction can be treated as an experiment introducing the creation of solutions based on this type of elements and the increasingly popular applications of 3D printers.
Investigation of the influence of the number of transducers on the directivity of the sound source and the distribution of the sound field
One method of increasing the directivity of a sound source is to use multiple transducers. An example of this are linear sound sources (linear arrays) used to sounden rooms, e.g. during concerts. Fig. 69 shows a view of a line source with a contact board with power amplifiers prepared for measurements.
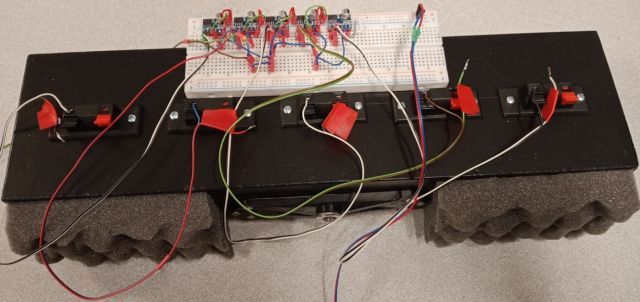
Fig. 69 View of the line source from the back, prepared for measurements
Fig. 70 shows a linear source with an attached protractor used to measure directional characteristics.

Fig. 70 shows a linear source with an attached protractor used to measure directional characteristics.
Fig. 71 shows a view of a line source with a protractor and a board with power amplifiers that control the speakers built into the source.

Fig. 71 Rear view of a line source with a protractor supporting angle determination when measuring directional characteristics
During the measurements, the influence of the number of transducers on the directivity characteristics of the sound source was examined. For this purpose, a line source and loudspeaker matrices were used, in which the loudspeakers were connected into vertical sections in such a way that each matrix consisted of five sections.
The block diagram of the connections of the source components is shown in Fig. 72. On the right side of the diagram there is an indication of which transducers were active during measurements of the influence of their number (1, 3 or 5) on directivity.
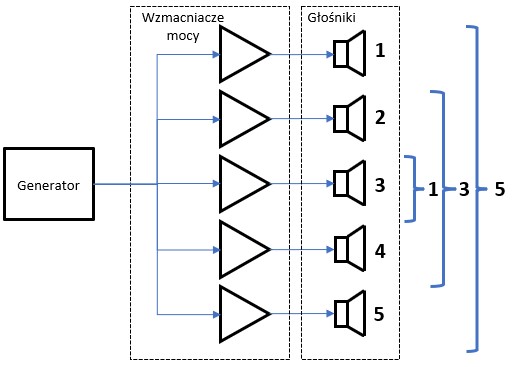
Fig. 72 Block diagram of the source with connections of components used when measuring directivity characteristics
The measurements included determining the directivity characteristics of the source when the directional source was excited with a sinusoidal signal in the frequency range from 125 Hz to 8 kHz.
Measurements were made using the Clio system and for all frequencies, sound pressure levels were determined based on FFT analysis (Fig. 73). This reduced the impact of external interference on the measurement results.
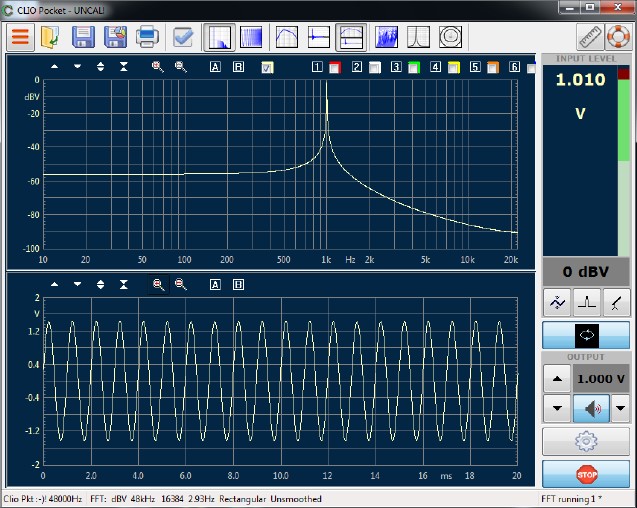
Fig. 73 View of the computer screen when determining the signal amplitude from the measurement microphone output
Fig. 74 shows the family of directional characteristics of a line source for frequencies from 125 Hz to 8 kHz when one transducer is excited (the center speaker or the center section number 3 in Fig. 72).
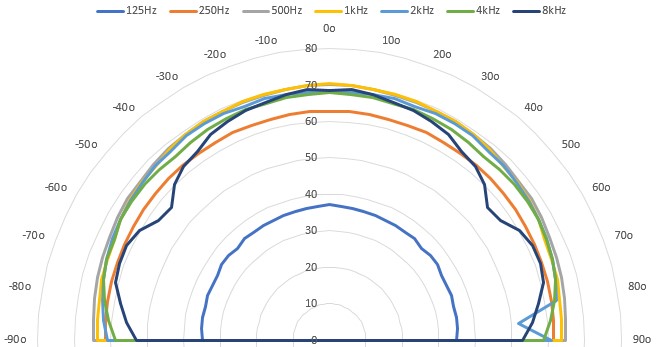
Fig. 74 Directional characteristics of the line source for different frequencies of the input signal with one (middle) loudspeaker operating
Measurements of the acoustic field distribution were made by performing nine measurements (3 x 3 measurements) on one square meter at the height of the middle point of the directional source. In each case, the measurement area was 3.0 x 4.5 m. The geometric center of the matrix in the drawings below is represented as a green point.
The distribution of the sound field for the frequency of 125 Hz is shown in Fig. 75. As you can see, it is consistent with the course of the directivity characteristic of the source, which for this frequency is close to omnidirectional (Fig. 74).
The sound pressure level on the main axis of the source at a distance of 1 m is 38 dB (this is the average value for 9 measurements). For an angle of 900, the sound pressure level is slightly lower and amounts to approximately 37 dB.
The distribution is symmetrical about the main axis of the directional source. At longer distances, the sound pressure level quickly approaches background noise levels.
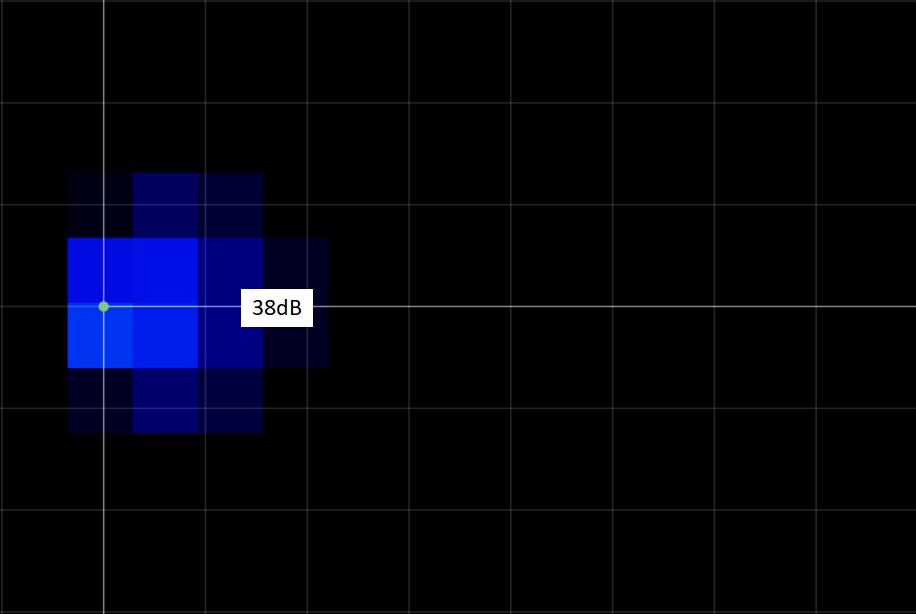
Fig. 75 Distribution of the acoustic field around a directional source (active one loudspeaker, signal frequency 125 Hz, area 3.0 x 4.5 m)
Fig. 76 shows the distribution of the sound field for a signal frequency of 250 Hz. Similarly to the 125 Hz signal, it corresponds to the radiation of a source with characteristics close to omnidirectional (Fig. 74).
On the main axis of the source, the sound pressure level has an average value of approximately 63 dB. As you can see, the efficiency of the source for the 63 Hz frequency is much higher than for the 125 Hz frequency.\The value of the sound pressure level for the entire half-full angle does not change. At a distance of 4 m from the source, the sound pressure level has an average value of approximately 50 dB. The distribution of the sound pressure level is symmetrical about the main axis of the directional source.
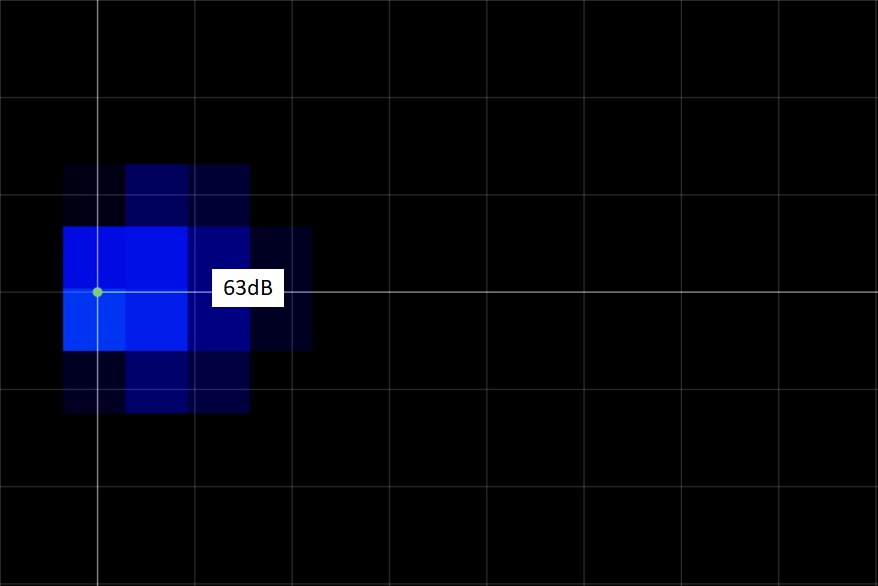
Fig. 76 Distribution of the acoustic field around the line source (active one loudspeaker, signal frequency 250 Hz, area 3.0 x 4.5 m)
Fig. 77 shows the distribution of the acoustic field for a signal with a frequency of 500 Hz. Similarly to the signal with a frequency of 125 Hz and 250 Hz, it corresponds to the radiation of a source with omnidirectional characteristics (Fig. 74).
The average value of the sound pressure level for nine measurements at a distance of 1 meter from the source on the main axis is equal to 70 dB. The sound pressure level at this point is therefore approximately 7 dB higher than the value for 250 Hz. The source at this frequency is not omnidirectional and for frequency 900 the value of the sound pressure level is 65 dB, which is 5 dB lower than the value on the main axis of the source.
At the edges of the measurement area, at a distance of 4 m from the source, the sound pressure level is 55 dB. The distribution of the sound pressure level is symmetrical about the main axis of the source, i.e. it is consistent with the directional characteristics of the source.
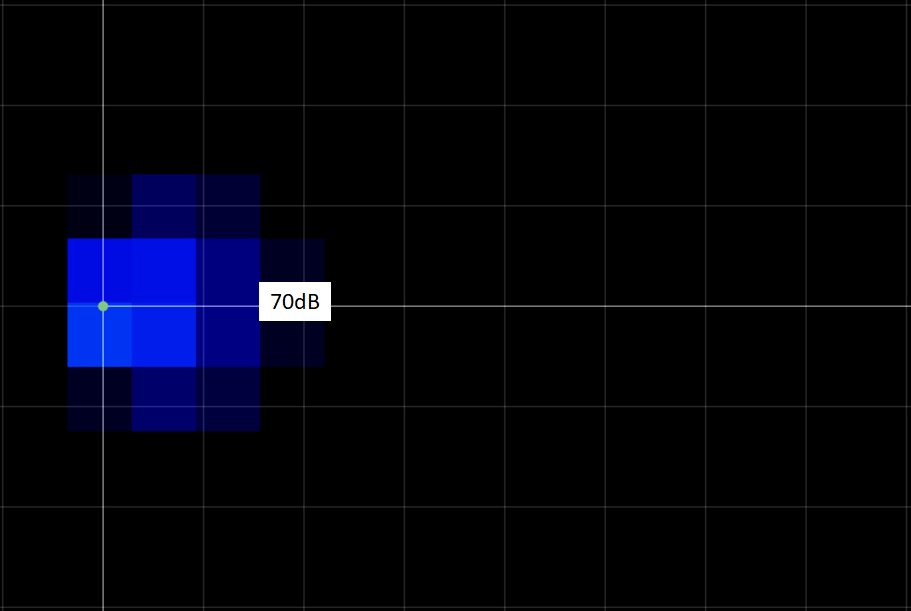
Fig. 77 Distribution of the acoustic field around the line source (active one loudspeaker, signal frequency 500 Hz, area 3.0 x 4.5 m)
Fig. 78 shows the distribution of the acoustic field for a signal with a frequency of 1 kHz. As in the case of signals with lower frequencies, it corresponds to the radiation of a source with omnidirectional characteristics (Fig. 74).
The value of the sound pressure level on the main axis of the matrix at a distance of 1 meter from its central point is 62 dB and is lower than the value measured for the frequency of 500 Hz by 8 dB. The measurements still show that we are dealing with a symmetrical acoustic field distribution relative to the main axis of the sound source.
There was no significant influence of the equipment of the room in which the measurements were taken on the distribution of the acoustic field. The averaging of measurement results certainly had a significant impact on eliminating the unfavorable impact of room parameters.
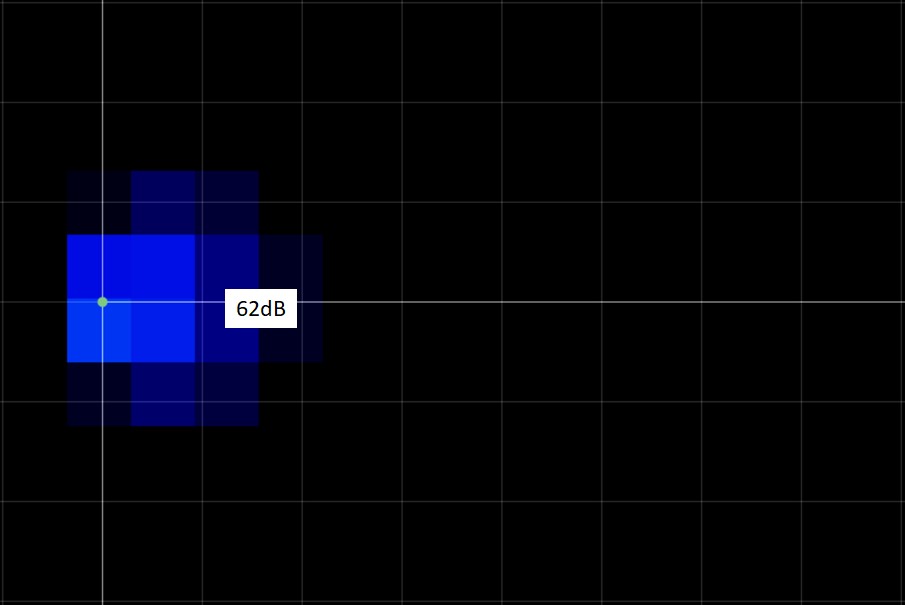
Fig. 78 Distribution of the acoustic field around the line source (active one loudspeaker, signal frequency 1000 Hz, area 3.0 x 4.5 m)
Fig. 79 shows the distribution of the acoustic field for a signal with a frequency of 2 kHz. As in the case of signals with lower frequencies, it corresponds to the radiation of a source with omnidirectional characteristics (Fig. 74).
The average value of the sound pressure level measured on the source axis at a distance of 1 meter is 69 dB. It is higher than the value measured for the frequency of 1 kHz by 7 dB.
As can be seen from Fig. 79, the distribution of the acoustic field in the measurement room is symmetrical relative to the main axis of the sound source. A small difference in sound pressure levels occurs directly at the source at an angle of 900 and -900, respectively. At this distance, the measurements were partially performed in the near field and hence, after averaging, the above-mentioned level differences could occur.
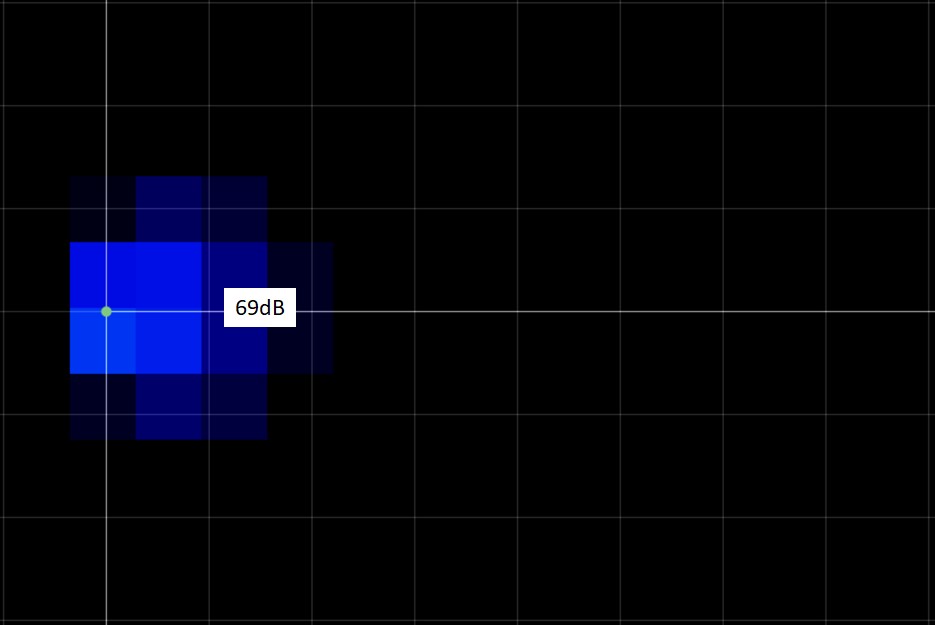
Fig. 79 Distribution of the acoustic field around the line source (active one loudspeaker, signal frequency 2000 Hz, area 3.0 x 4.5 m)
Fig. 80 shows the distribution of the acoustic field for a signal with a frequency of 4 kHz. As in the case of signals with lower frequencies, it corresponds to the radiation of a source with omnidirectional characteristics (Fig. 74).
The value of the sound pressure level measured on the main axis at a distance of 1 meter from the source is 68 dB.
The distribution of the sound field for a signal with a frequency of 4 kHz is very similar to that for a signal with a frequency of 2 kHz. The distribution of the sound pressure level is symmetrical about the main axis of the sound source.
As in the case of the 2 kHz signal, a slight difference in the sound pressure level near the source can be observed for angles 900 and -900.
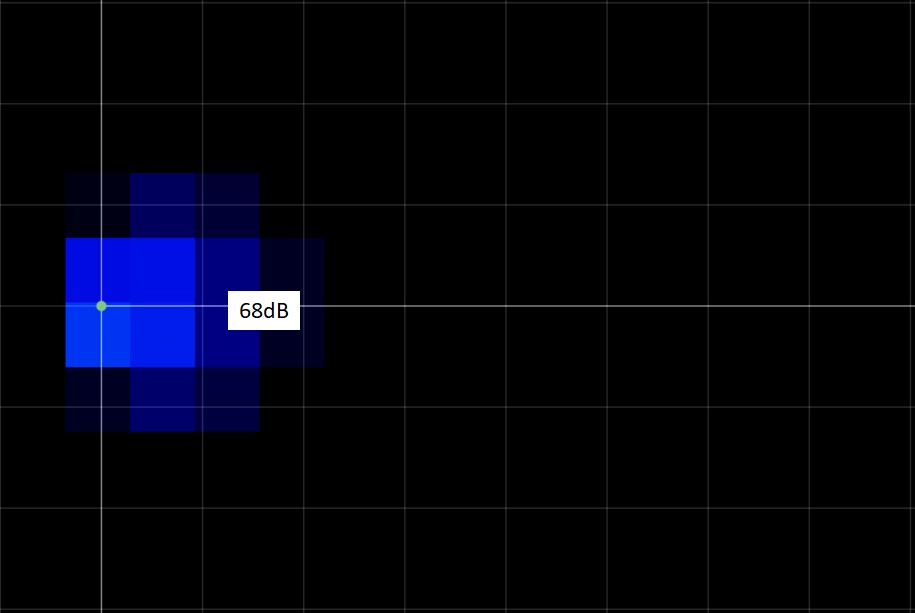
Fig. 80 Distribution of the acoustic field around the line source (active one loudspeaker, signal frequency 4000 Hz, area 3.0 x 4.5 m)
Fig. 81 shows the distribution of the acoustic field for a signal with a frequency of 8 kHz. As in the case of signals with lower frequencies, it corresponds to the radiation of a source with omnidirectional characteristics (Fig. 74).
The average value of the sound pressure level at a distance of 1 meter on the main axis of the sound source is equal to 67 dB. The sound pressure level is symmetrical about the main axis of the source.
The average sound pressure level measured at a distance of 4 m from the source is 55 dB.
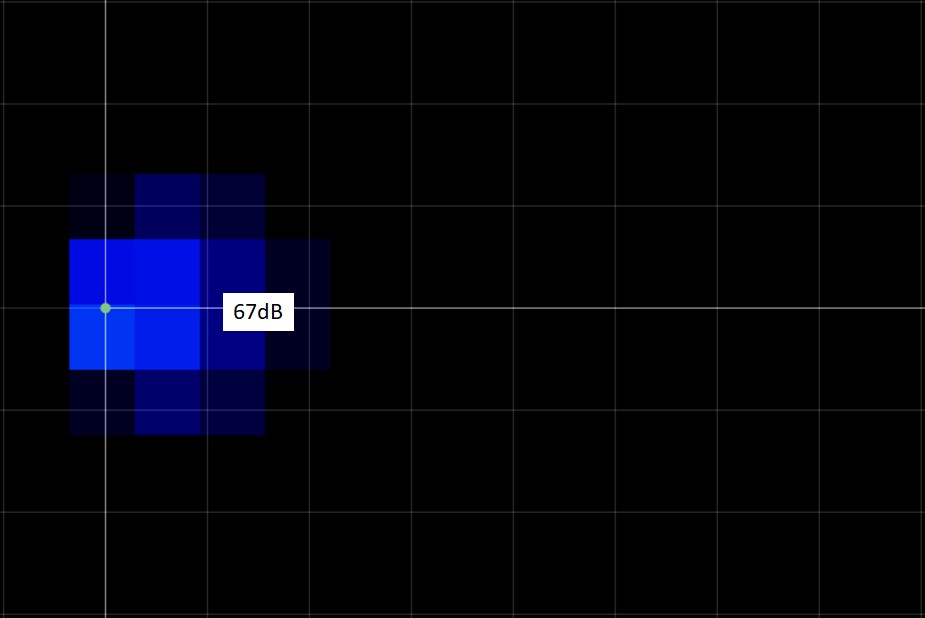
Fig. 81 Distribution of the acoustic field around the line source (active one loudspeaker, signal frequency 8000 Hz, area 3.0 x 4.5 m)
As can be seen in the case when one matrix loudspeaker is excited, regardless of the frequency, the matrix is a source with characteristics similar to omnidirectional and the distribution of the acoustic field in the measurement room is symmetrical in relation to the main axis of the sound source and is also omnidirectional.
The change in the sound pressure level does not result from a change in the directional characteristics of the sound source, but from a change in the distance from the source.
Fig. 82 shows the family of matrix directional characteristics for frequencies from 125 Hz to 8 kHz when three transducers are excited (speakers numbers 2, 3 and 4 shown in Fig. 72).
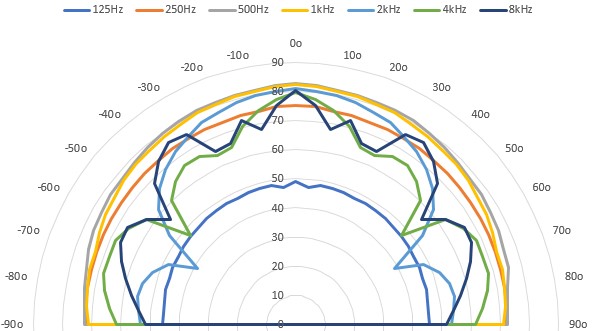
Fig. 82 Directional characteristics of the line source for different frequencies of the input signal with three loudspeakers working
The distribution of the sound field for the frequency of 125 Hz is shown in Fig. 83. As you can see, it is consistent with the directionality of the source, which is omnidirectional for this frequency (Fig. 82). The level value is higher than the value shown in Fig. 75, which is due to the fact that in this case three, not one, loudspeakers are active, and the amplitude of the control signal is the same.
The value of the sound pressure level on the main axis of the source at a distance of 1 meter is 49 dB. During the measurements, a small difference in levels was observed at a distance of 0.5 meters from the source at an angle of 900. This difference, however, is small and may result from the fact that during averaging, some of the measurements were made in the near field.
The distribution of the sound field is symmetrical about the main axis up to approximately 3 meters from the central point from the sound source. Above this distance, differences in sound pressure levels of approximately 1 dB were observed.
At a distance of 4 meters from the source, the sound pressure level decreases to the level of background noise and the measurement results cannot be reliable.
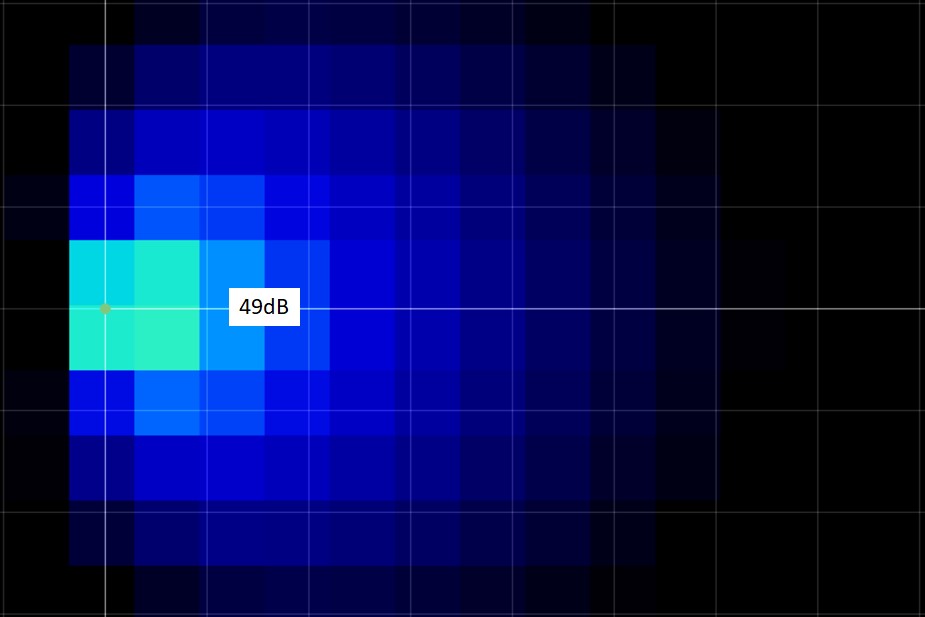
Fig. 83 Distribution of the acoustic field around the line source (three active loudspeakers, signal frequency 125 Hz, area 3.0 x 4.5 m)
The distribution of the sound field for the frequency of 250 Hz is shown in Fig. 84. As you can see, it is consistent with the course of the directivity characteristic of the source, which for this frequency is close to omnidirectional, as illustrated by the characteristic shown in Fig. 82.
he distribution is symmetrical about the main axis of the directional source up to a distance of 1.2 m from this axis. For larger distances, the measured values of sound pressure levels differ by 0.5 dB to 1.0 dB.
At a distance of 2.5 meters, the values of sound pressure levels approach the level of 50 dB, i.e. the value measured at a distance of 1 meter from the source for a frequency of 125 Hz. We can therefore observe a strong increase in the sound pressure level, similarly to the case when one loudspeaker in a directional source is active (Fig. 76).
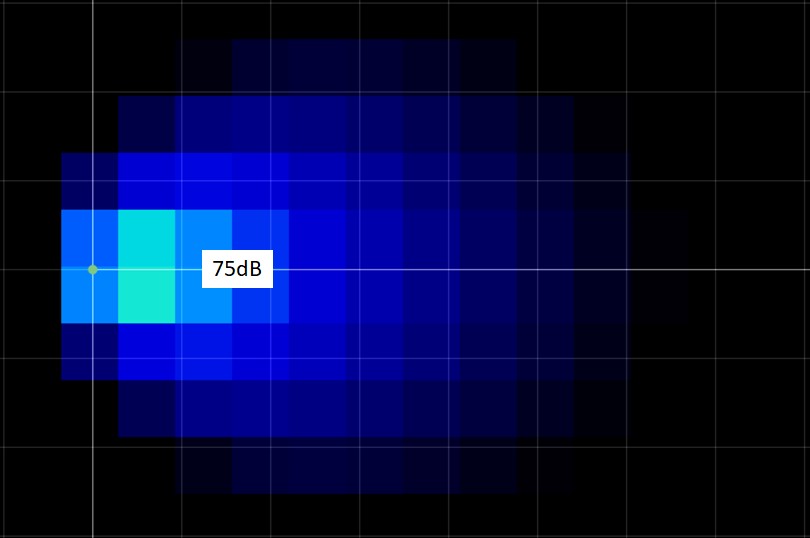
Fig. 84 Distribution of the acoustic field around the line source (three active loudspeakers, signal frequency 250 Hz, area 3.0 x 4.5 m)
The distribution of the sound field for the frequency of 500 Hz is shown in Fig. 85. As you can see, it is consistent with the course of the directionality characteristics of the source, which at this frequency begins to show an obvious directional character. The value of the sound pressure level on the main axis at a distance of 1 meter from the source is 83 dB. The distribution is symmetrical about the main axis of the directional source.
Some asymmetry was observed at a distance of 0.5 meters from the source near the main axis (it is visible on the acoustic field distribution graph as a lighter square), but this is probably due to some measurements being made in the near field. When only measurement results at a distance of approximately 0.75 meters on both sides of the main axis of the source were taken into account for averaging purposes, the results practically coincided.
Due to the fact that all measurement results were obtained by averaging nine measurements per square meter, the discrepancy in the distribution of the acoustic field near the source shown in the figure was left.
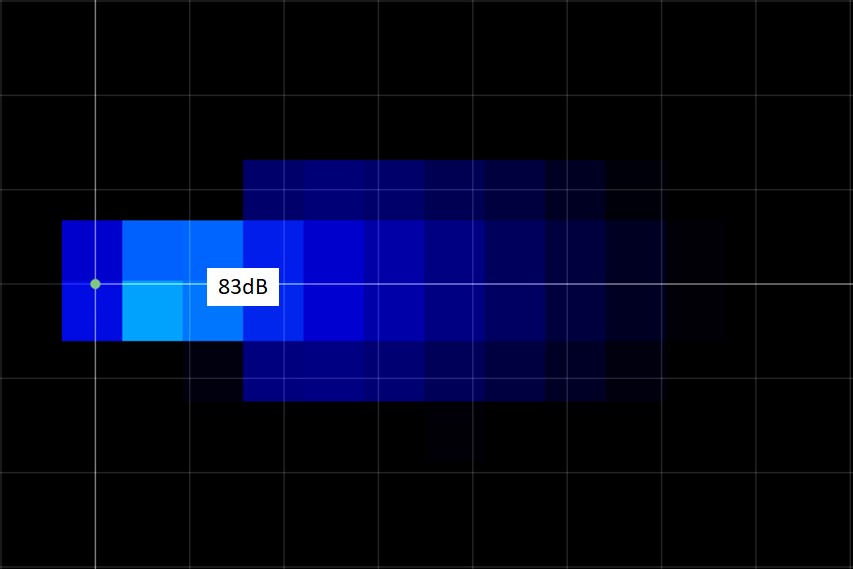
Fig. 85 Distribution of the acoustic field around the line source (three active loudspeakers, signal frequency 500 Hz, area 3.0 x 4.5 m)
The distribution of the sound field for a frequency of 1 kHz is shown in Fig. 86. The distribution is not symmetrical about the main axis of the directional source.
The value of the pressure level measured on the source axis at a distance of 1 meter from its central part is equal to 82 dB. The distribution of the sound field reflects the directional parameters of the source.
Regardless, there are clear discrepancies in the sound pressure levels on the left and right sides of the main axis. These discrepancies in detail are not the same as the course of the directional characteristics shown in Fig. 82. Therefore, the influence of the parameters of the room in which the measurements were made is visible. The decrease in the sound pressure level is particularly noticeable at a distance of 0.5 meters from the source and 0.5 meters and 1.0 meters from its main axis.
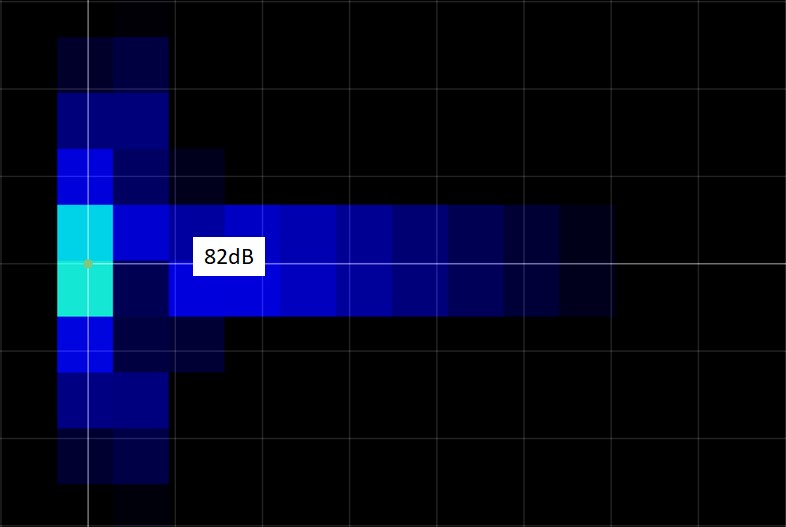
Fig. 86 Distribution of the acoustic field around the line source (three active loudspeakers, signal frequency 1000 Hz, area 3.0 x 4.5 m)
Fig. 87 shows the distribution of the acoustic field for the test signal frequency of 2 kHz. The distribution reflects the directional characteristics of a source with two sidelobes. The value of the sound pressure level measured on the main axis of the source at a distance of 1 meter is equal to 78 dB.
Apart from the fact that in general terms the distribution of the sound field resembles the directional characteristics of a source with two sidelobes, it contains many areas in which the values of sound pressure levels on both sides of the main axis of the source are not equal. The distribution is therefore not fully symmetrical relative to the main axis of the directional source. Therefore, the influence of the parameters of the room in which the measurements were taken is visible.
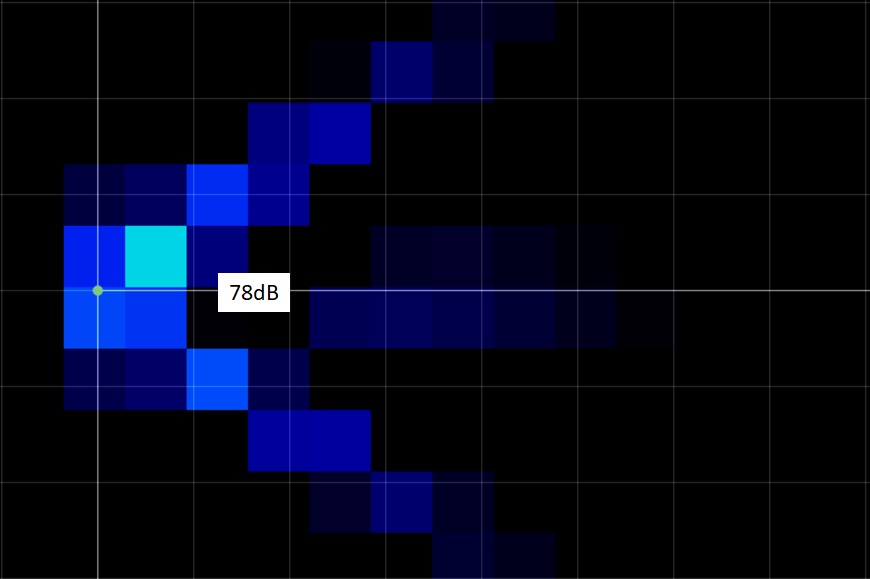
Fig. 87 Distribution of the acoustic field around the line source (three active loudspeakers, signal frequency 2000 Hz, area 3.0 x 4.5 m)
The distribution of the sound field at a frequency of 4 kHz is shown in Fig. 88. The value of the sound pressure level on the main axis at a distance of 1 meter from the central point of the source is 77 dB. As in the case of a 1 kHz signal, the sound field distribution resembles the directional characteristics of a source with two sidelobes.
The distribution is not symmetrical about the main axis of the directional source. You can see the influence of the parameters of the room in which the measurements were taken. This influence is especially visible at a distance of up to 1.5 meters from the source. An interesting phenomenon is the fact that the sound pressure level associated with the side lobes at a distance of 2 meters from the source is higher than the pressure level on the main axis of the source. Thus, the distribution of the acoustic field confirms the fact that there are two sidelobes on the directional characteristic, but it does not confirm the fact that the source is more effective on the main axis compared to the sidelobes. The reason for such measurement results may be the influence of the room in which they were performed.
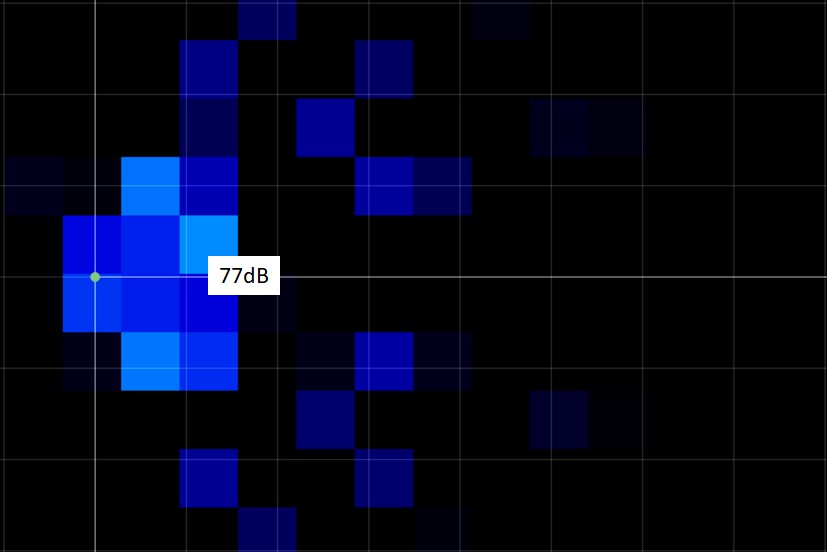
Fig. 88 Distribution of the acoustic field around the line source (three active loudspeakers, signal frequency 4000 Hz, area 3.0 x 4.5 m)
The distribution of the sound field for the highest frequency of 8 kHz is shown in Fig. 89. Similarly to the 4 kHz signal, the distribution is not symmetrical relative to the main axis of the directional source, and the lack of symmetry is much greater. The average value of the sound pressure level on the main axis at a distance of 1 meter from the source is equal to 77 dB. The directional characteristic of the source for a frequency of 8 kHz (Fig. 82) has two clearly outlined side lobes for each quarter of the full angle and two small lobes near the main axis.
In the drawing showing the distribution of the acoustic field, the mentioned side lobes are not visible. The distribution is chaotic. Non-uniform sound pressure levels are visible throughout the entire measurement area. The exception are the results of measurements along straight lines placed at an angle of 900 to the main axis of the source.
To sum up, we can see both the influence of the parameters of the room in which the measurements were made and the effect of averaging the measurement results, i.e. too sparse the measurement grid shown in Fig. 89.
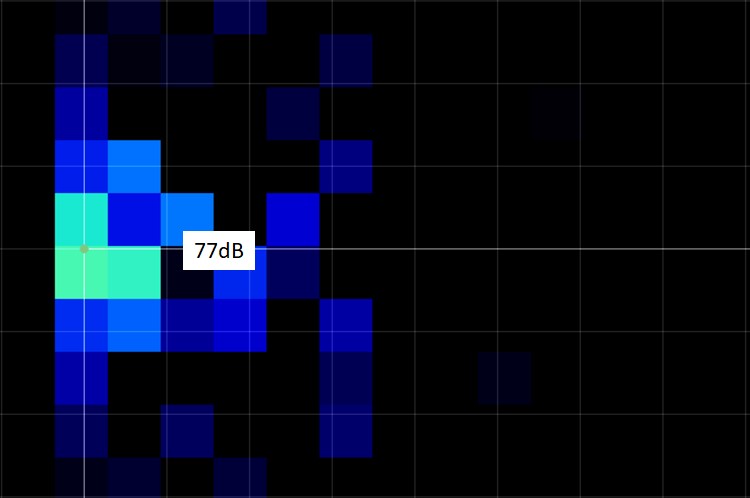
Fig. 89 Distribution of the acoustic field around the line source (three active loudspeakers, signal frequency 8000 Hz, area 3.0 x 4.5 m)
In order to check the influence of the resolution of the measurement and presentation grid on the measurement results analyzed, Fig. 90 shows the distribution of the acoustic field for three loudspeakers (three sections) excited by an 8 kHz signal with increased resolution of measurements (measurement points). This is exactly the sound field distribution corresponding to that shown in Fig. 89.
As you can see, the distribution of the sound field more closely resembles the directional characteristics of the source at a frequency of 8 kHz. You can see the main lobe and a number of directions related to the side lobes of the source radiation characteristics. Two blades close to radiation directions close to 900 are particularly visible.
Increasing the resolution (number of measurement points) and presentation of measurement results improves the graphical possibilities of presenting the results for analysis. The problem, however, is the time-consuming nature of performing such measurements. This was the main reason that measurements with increased resolution for the three and five active loudspeakers in the array described later were only performed at a signal frequency of 8 kHz.
However, such a limitation is only an apparent limitation, as discrepancies between the sound field distributions and directional characteristics appear primarily for the frequency of 8 kHz.
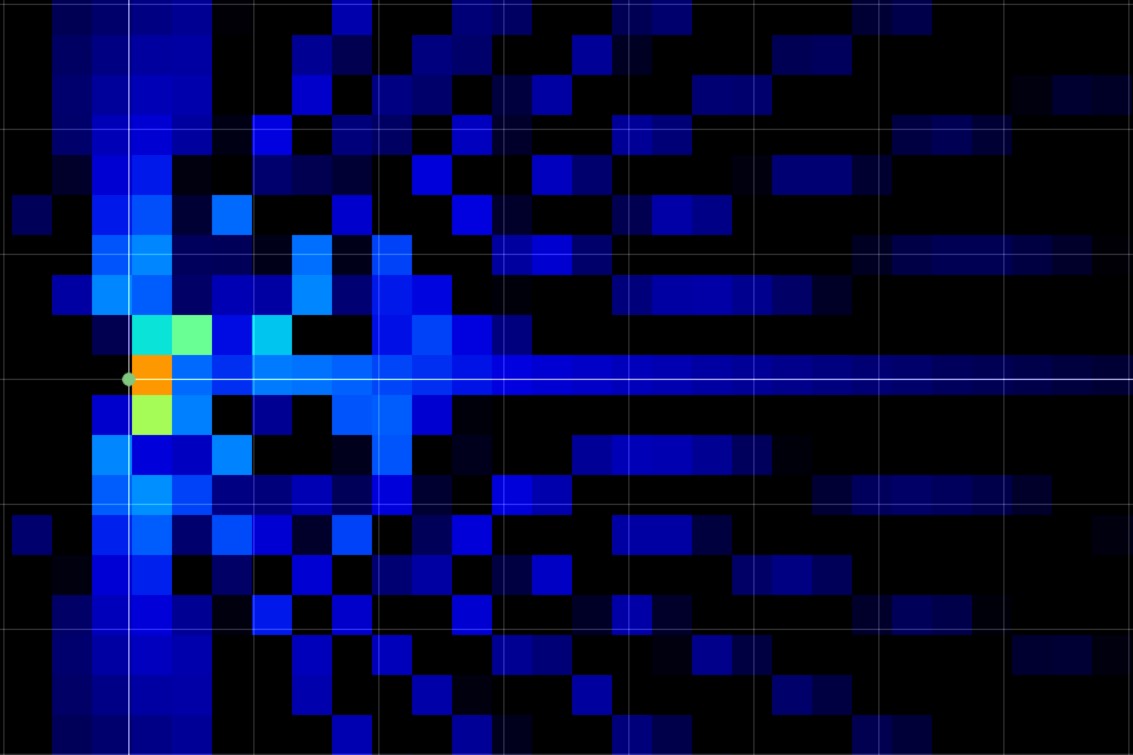
Fig. 90 Distribution of the acoustic field around the line source (three active loudspeakers, signal frequency 8000 Hz, area 3.0 x 4.5 m - increased measurement resolution)
The next set of acoustic field measurements concerned five active loudspeakers.
Fig. 91 shows the family of directional characteristics for signal frequencies from 125 Hz to 8 kHz when five transducers are excited (speakers or sections numbered 1, 2, 3, 4 and 5 in Fig. 72).
For comparison, Fig. 92 shows the family of directional characteristics of the matrix in the second version when all loudspeakers are excited.
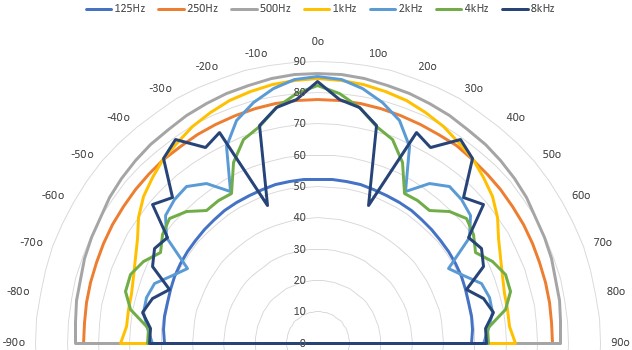
Fig. 91 Directional characteristics of the line source for different frequencies of the input signal with five speakers operating
As you can see, apart from the details regarding the characteristics, their nature is similar to those shown in Fig. 91.
Up to a frequency of 1 kHz, the characteristics are close to omnidirectional. Only the source efficiency changes - it is the lowest for the frequency of 125 Hz. This is not surprising considering the fact that both the line source, the first version matrix and the second version matrix use transducers with small diameters.
For a frequency of 1 kHz and a radiation angle of 90°, some directional features can already be observed. However, they are small. In the case of the second version of the matrix, for a signal frequency of 500 Hz, a decrease in the sound pressure value was observed for an angle of 50 in relation to the main axis of radiation. This decrease is asymmetric and may be related to the mechanical structure of the matrix (Fig. 58, Fig. 60, Fig. 61, Fig. 66, Fig. 68).
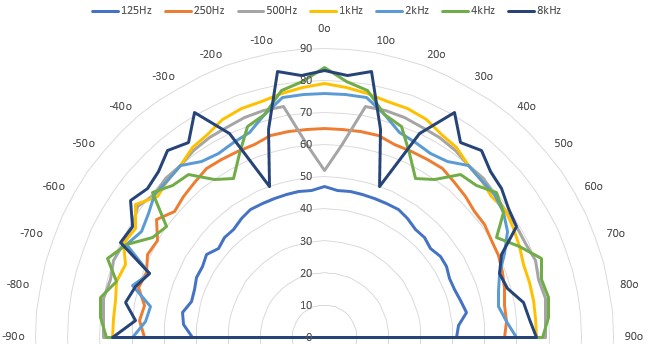
Fig. 92 Directional characteristics of the directional matrix in the second version for different frequencies of the input signal with five loudspeaker sections operating
Taking into account the similarity of the directional characteristics shown in Fig. 91 and Fig. 92, the acoustic field distributions shown below will be based on the linear source and matrix in the first version, i.e. the directional characteristics shown in Fig. 91.
Fig. 93 shows the distribution of the sound field when the source is excited by a signal with a frequency of 125 Hz. The sound pressure level on the main axis of the source at a distance of 1 meter from the center loudspeaker is 53 dB. It is higher by the sound pressure level measured and presented in Fig. 75 and Fig. 83 due to the larger number of excited loudspeakers (as a reminder, the amplitude of the control signal during measurements using one, three and five loudspeakers was always the same). Even at a distance of 4 meters from the source, the sound pressure level exceeded 45 dB, which was higher than the background noise level.
The distribution of the sound pressure level is symmetrical about the main axis of the sound source. It reflects the omnidirectional radiation characteristics of the source. Small (1.5 dB) drops in the sound pressure level are visible at a distance of 3.0 meters from the source at an angle of 900 (symmetrically on both sides of the source).
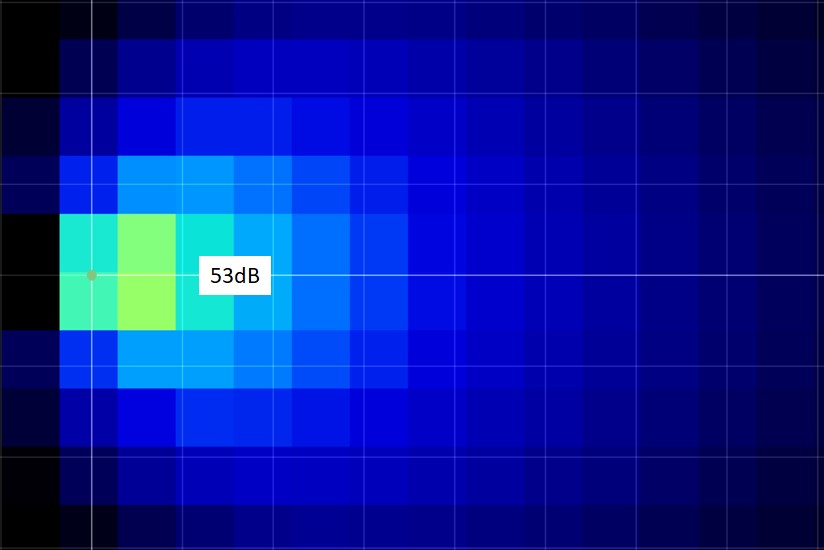
Fig. 93 Distribution of the sound field around the line source (five loudspeakers are active, signal frequency 125 Hz, area 3.0 x 4.5 m)
Fig. 94 shows the distribution of the sound field when the source is excited by a signal with a frequency of 250 Hz. The distribution reproduces the radiation of a directional source.
The sound pressure level on the main axis of the source at a distance of 1 meter from the center loudspeaker is 78 dB. A significant increase in the level value can be observed compared to the value for the 125 Hz frequency. The distribution of sound pressure levels is symmetrical relative to the main axis of the source radiation, which is confirmed by the average measurement results.
An interesting phenomenon observed was a decrease in the value of the sound pressure level measured directly at the source to the value of the level measured at a distance of 1 meter from the source after an increase in the value at a distance of 0.5 meters from the source.

Fig. 94 Distribution of the sound field around the line source (five loudspeakers are active, signal frequency 250 Hz, area 3.0 x 4.5 m)
Fig. 95 shows the distribution of the sound field when the source is excited by a signal with a frequency of 500 Hz. The average value of the sound pressure level on the main axis at a distance of 1 meter from the center speaker is 86 dB. This is one of the highest values measured during the measurements.
The distribution of the sound field reflects the directional nature of the source. It is symmetrical about the main axis of the source.
An interesting phenomenon is the decrease in the sound pressure level at a distance of 0.5 meters from the source compared to the level of 1.0 meters from the source.

Fig. 95 Distribution of the acoustic field around the line source (five loudspeakers are active, signal frequency 500 Hz, area 3.0 x 4.5 m)
Fig. 96 shows the distribution of the acoustic field when the source is excited by a signal with a frequency of 1 kHz. The sound pressure level on the main axis at a distance of 1 meter from the center speaker is 88 d/B.
The distribution of the sound field is symmetrical about the main axis of the source with some deviations immediately near the sound source.
At a distance of 2 meters from the source, the sound pressure levels along the main axis decrease uniformly on both sides of the main radiation axis.

Fig. 96 Distribution of the acoustic field around the line source (five loudspeakers are active, signal frequency 1000 Hz, area 3.0 x 4.5 m)
Fig. 97 shows the distribution of the acoustic field when the source is excited by a 2 kHz signal. The average sound pressure level at a distance of 1 meter on the main axis of the source is 88 dB.
The distribution of the sound pressure level resembles the directional characteristics of the source (Fig. 92) for a frequency of 2 kHz. The difference is that in the directional characteristics the sidelobes are slightly outlined, while in the acoustic field distribution they are clearly visible.
The characteristics are only close to symmetrical. It is slightly moved (down by 1 meter). This also applies to sound pressure levels measured along the main axis of the source.

Fig. 97 Distribution of the acoustic field around the line source (five loudspeakers are active, signal frequency 2000 Hz, area 3.0 x 4.5 m)
Fig. 98 shows the distribution of the acoustic field when the source is excited by a 4 kHz signal. The value of the sound pressure level on the main axis of the source at a distance of 1 meter from the center loudspeaker is equal to 83 dB. It is therefore 5 dB lower than the value measured at a frequency of 2 kHz.
The distribution of the sound field in the measurement room is, on the one hand, symmetrical, but on the other hand, the values of sound pressure levels differ significantly. This phenomenon reflects the rather "jagged" course of the source directivity characteristic shown in Fig. 91, which means changes in the value of the acoustic pressure level of the radiated signal with changes in the radiation angle, and therefore also in the measurement point in relation to the main axis of the source.

Fig. 98 Distribution of the acoustic field around the line source (five loudspeakers are active, signal frequency 4000 Hz, area 3.0 x 4.5 m)
The distribution of the acoustic field for the frequency of the signal stimulating the directional source equal to 8 kHz shown in Fig. 99, similarly to the frequency of 4 kHz (Fig. 98), is irregular.
This irregularity is, of course, even greater than in the case of the 4 kHz frequency and is related to the more irregular directivity characteristics of the source shown in Figure 91.
The presented sound field distribution, similarly to the case of excitation of three loudspeakers (Fig. 89), is additionally sensitive to the number of measurement points.
A certain regularity occurs only in the case of the values of sound pressure levels measured for angles 900 and -900. For these angles, the field distribution is symmetric.
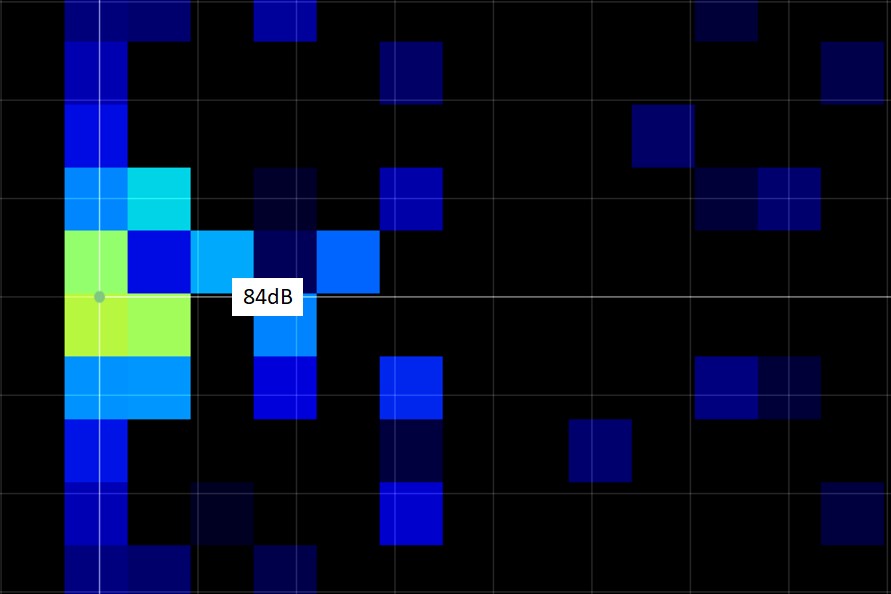
Fig. 99 Distribution of the acoustic field around the line source (five loudspeakers are active, signal frequency 8000 Hz, area 3.0 x 4.5 m)
Similarly to the case of three active loudspeakers and a frequency of 8 kHz, in order to show the distribution of the sound field at a frequency of 8 kHz, a series of measurements was performed for a fourfold increase (as in the case of excitation of three loudspeakers) of the number of measurement points.
The view of the sound field distribution is shown in Fig. 100. Unlike the sound field distribution shown in Fig. 99, there is symmetry with respect to the main axis of the loudspeaker, corresponding to the symmetry of the directional characteristics of the source shown in Fig. 91.
It concerns both the main axis of radiation (decrease in the sound pressure level with distance from the source) and the side lobes appearing on the directional characteristics of the source.
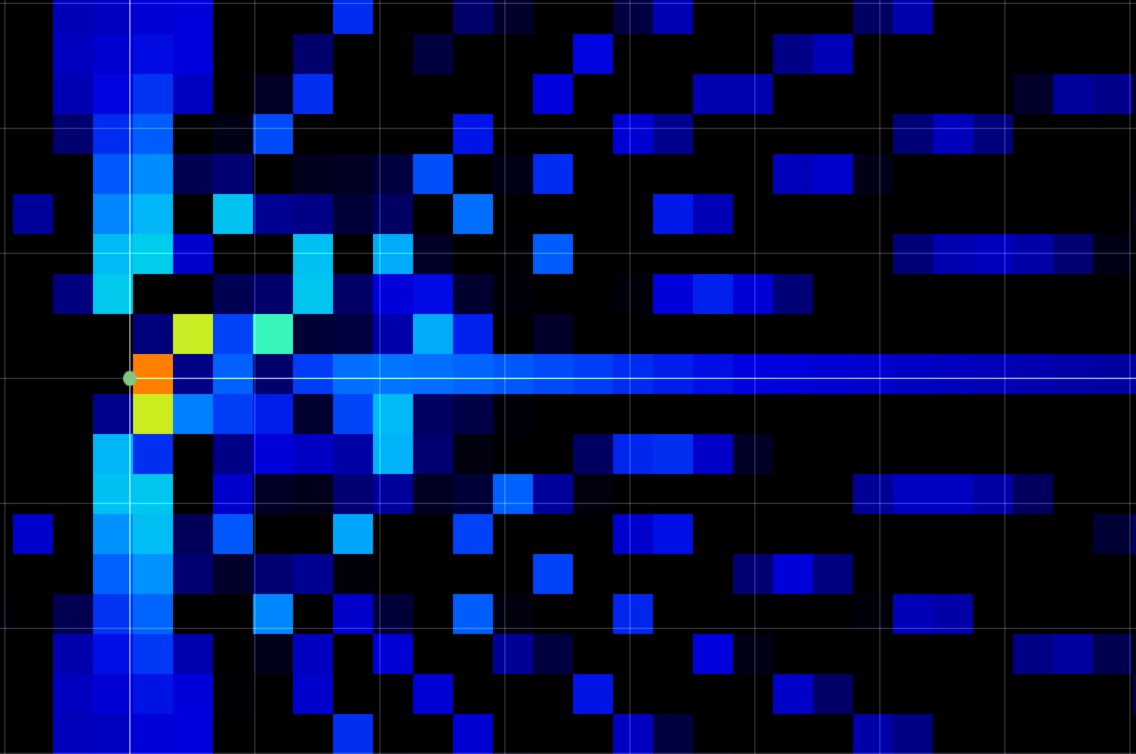
Fig. 100 Distribution of the acoustic field around the line source (five loudspeakers are active, signal frequency 8000 Hz, area 3.0 x 4.5 m, increased resolution)
Fig. 101 shows a comparison of the directional characteristics of the sources (Fig. 28, Fig. 48, Fig. 60) when energizing a single, three and five loudspeakers or loudspeaker sections. The frequency of the excitation signal is 125 Hz.
The visible difference in levels results from the fact that regardless of the number of speakers, the amplitude of the control signal is the same (the amplifier inputs are connected in parallel). Therefore, as the number of active speakers increases, the sound pressure level measured at the same point increases.
Some differences may result from the influence of the room, or more precisely, reflected waves at specific sound pressure levels and the interaction of waves produced by loudspeakers mounted in a directional source. In principle, however, as the number of speakers increases, the low-frequency directional characteristics should be enlarged versions of the characteristics for a smaller number of speakers, and this is the relationship that occurs in the case of the measured families of characteristics for 125 Hz (Fig. 101) and 250 Hz (Fig. 102).
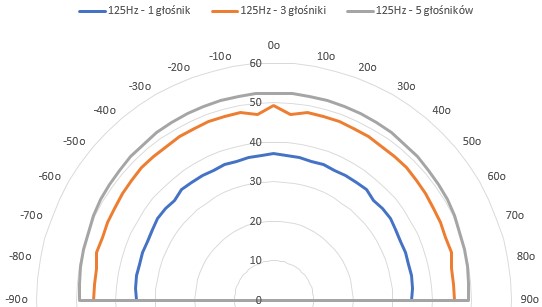
Fig. 101 Comparison of the directional characteristics of a line source for a different number of transducers for an input signal with a frequency of 125 Hz
Fig. 102 shows a comparison of the directional characteristics of the sources (Fig. 28, Fig. 48, Fig. 60) when energizing a single, three and five loudspeakers or loudspeaker sections. The frequency of the excitation signal is 250 Hz.
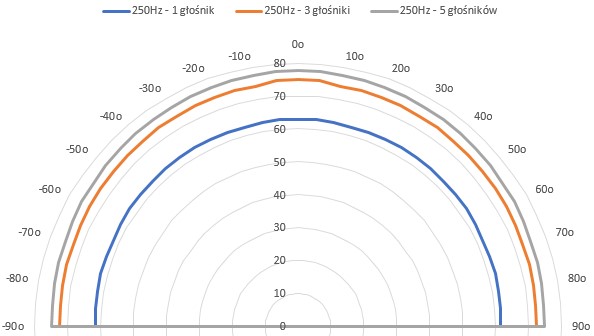
Fig. 102 Comparison of the directional characteristics of a line source for a different number of transducers for an input signal with a frequency of 250 Hz
Fig. 103 shows a comparison of the directional characteristics of the sources (Fig. 28, Fig. 48, Fig. 60) when energizing a single, three and five loudspeakers or loudspeaker sections. The frequency of the excitation signal is 500 Hz. Unlike the characteristics for 125 Hz and 250 Hz control signals at a frequency of 500 Hz, the similarity of the directional characteristics for one, three and five loudspeakers ends at an angle of 500. Above this angle, the sound pressure level decreases, the greater the number of active loudspeakers in the the investigated directional source. This means that the directivity of the source at a frequency of 500 Hz, i.e. for a relatively low frequency, increases with the increase in the number of active transducers in the loudspeaker array.
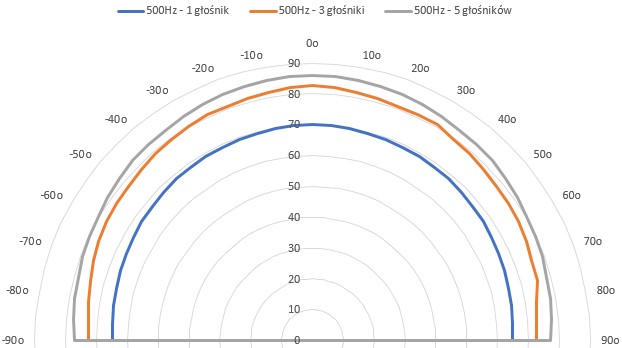
Fig. 103 Comparison of the directional characteristics of a line source for a different number of transducers for an input signal with a frequency of 500 Hz
Fig. 104 shows a comparison of the directional characteristics of sound sources (Fig. 28, Fig. 48, Fig. 60) when energizing a single, three and five loudspeakers or loudspeaker sections. The frequency of the excitation signal is 1 kHz. In this case, only for one and three loudspeakers in a certain range of the radiation angle (up to 300 from the main axis of the source) the characteristics are omnidirectional. The value of the sound pressure level above the angle of 300 begins to decrease and drops by 6 dB for the angle of 900. When five loudspeakers are excited, the directivity characteristic is directional.
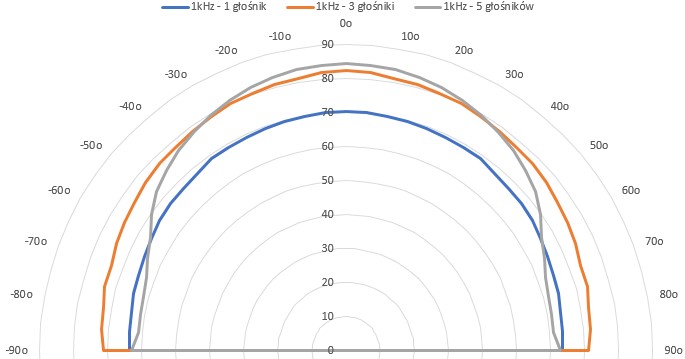
Fig. 104 Comparison of the directional characteristics of a line source for a different number of transducers for an input signal with a frequency of 1 kHz
Fig. 105 shows a comparison of the directional characteristics of the sources (Fig. 28, Fig. 48, Fig. 60) when energizing a single, three and five loudspeakers or loudspeaker sections. The frequency of the excitation signal is 2 kHz.
In the case of a single loudspeaker, the directivity pattern up to a radiation angle of 40° is omnidirectional. Above this angle, the value of the sound pressure level decreases from 68 dB on the main axis to 60 dB for a radiation angle of 900.
To excite three and five loudspeakers, we deal with typical directional characteristics.
In the case of three loudspeakers, we are dealing with a characteristic with two distinct side lobes in the semi-full angle. These blades have maximum radiation values for angles of 700 and -700, respectively.
In the case of five active loudspeakers, we are dealing with a characteristic with four side lobes in a semi-full angle. These blades have maximum radiation values for angles of 450 and -450 and 700 and -700, respectively.
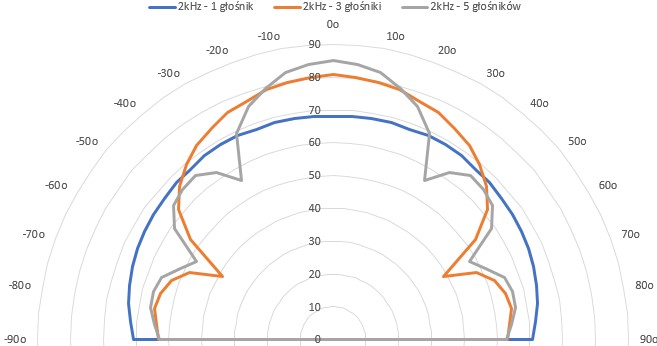
Fig. 105 Comparison of the directional characteristics of a line source for a different number of transducers for an input signal with a frequency of 2 kHz
Fig. 106 shows a comparison of the directional characteristics of the sources (Fig. 28, Fig. 48, Fig. 60) when energizing a single, three and five loudspeakers or loudspeaker sections. The frequency of the excitation signal is 4 kHz.
As you can see, in the case of a single loudspeaker, the radiation pattern for an angle of up to 60° is close to the omnidirectional pattern. Above the angle of 600, a drop in level is observed from 70 dB to 57 dB for the angles of 900 and -900, respectively.
The directional characteristics for the frequency of 4 kHz and three and five active loudspeakers are clearly directional and, in addition to the distinguished main radiation direction consistent with the main axis, the sources have side lobes.
In the case of three loudspeakers, we are dealing with two symmetrical side lobes for angles of 400 and 700, respectively, and their equivalents for angles -400 and -700.
The directional characteristic for five loudspeakers, similarly to the case of three loudspeakers, has two side lobes on each side of the main axis of the sound source (500 and 750 and -500 and -750). The side lobes are less distinguished than when only three speakers are active. The directional characteristic is therefore less "expressive" than in the case of active three loudspeakers (the difference in sound pressure levels between the maximum value of each lobe compared to the corresponding lobe of the directional characteristic for the three active loudspeakers of the measured source and its minimum value is much smaller). This phenomenon only occurred in this single case.
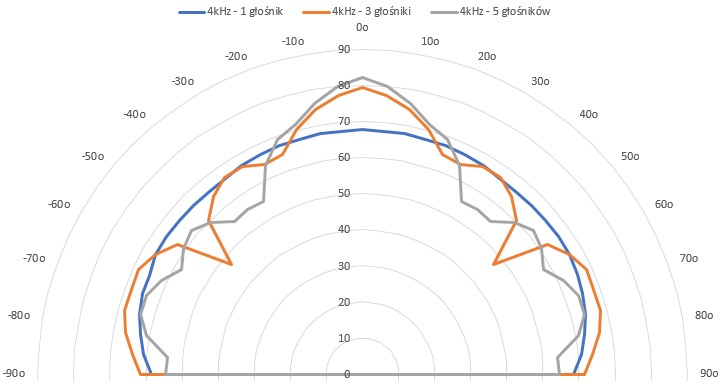
Fig. 106 Comparison of the directional characteristics of a line source for a different number of transducers for an input signal with a frequency of 4 kHz
Fig. 107 shows a comparison of the directional characteristics of the sources (Fig. 28, Fig. 48, Fig. 60) when energizing a single, three and five loudspeakers or loudspeaker sections. The frequency of the excitation signal is 8 kHz.
An interesting phenomenon is a clear reduction in the sound pressure level of the emitted signal for an angle of 200 and five active loudspeakers. This effect is even more visible because in the case of this frequency and this number of loudspeakers on the main axis, the highest sound pressure level is observed, measured at a distance of 1 meter from the directional source (above 80 dB).
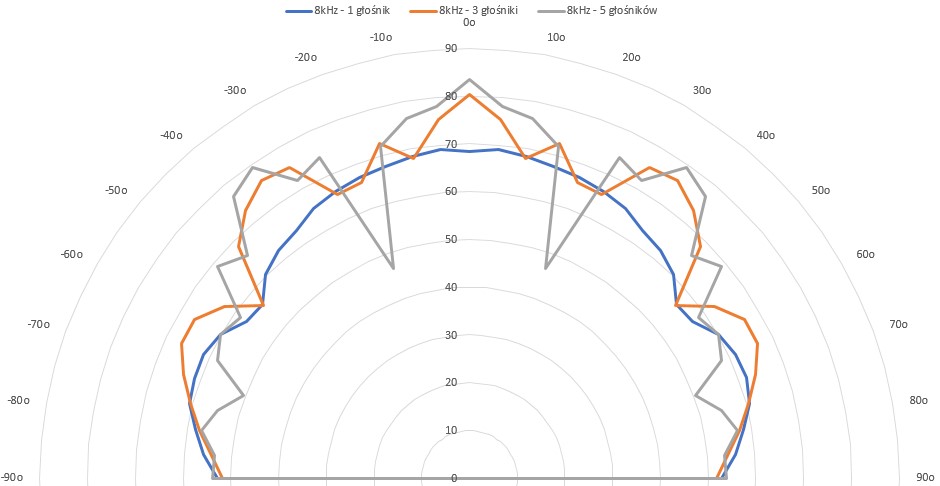
Fig. 107 Comparison of the directional characteristics of a line source for a different number of transducers for an input signal with a frequency of 8 kHz
The measurement results show that the directionality of the line source can be adjusted without the need to control the parameters of the control signals, but only by increasing the number of loudspeakers placed in the line source.
similarly to the case of the line source, measurements were made of the influence of the number of loudspeaker sections on the directional characteristics and acoustic field distribution for the loudspeaker matrix in the first version.
Fig. 108 shows a fragment of a loudspeaker matrix with loudspeakers connected in such a way that they form independent sections. The way the speakers are connected ensures proper matching of the speaker impedance to the output impedance of the power amplifiers. The speakers are connected in parallel and in series.
The markings on the cables ensure that the speakers are connected in phase to the outputs of the power amplifiers during measurements. The connections inside the matrix housing, as described earlier, ensure that, while maintaining the correct connection of the amplifier outputs to the appropriately color-coded speaker terminals, all acoustic signals have the same phase.
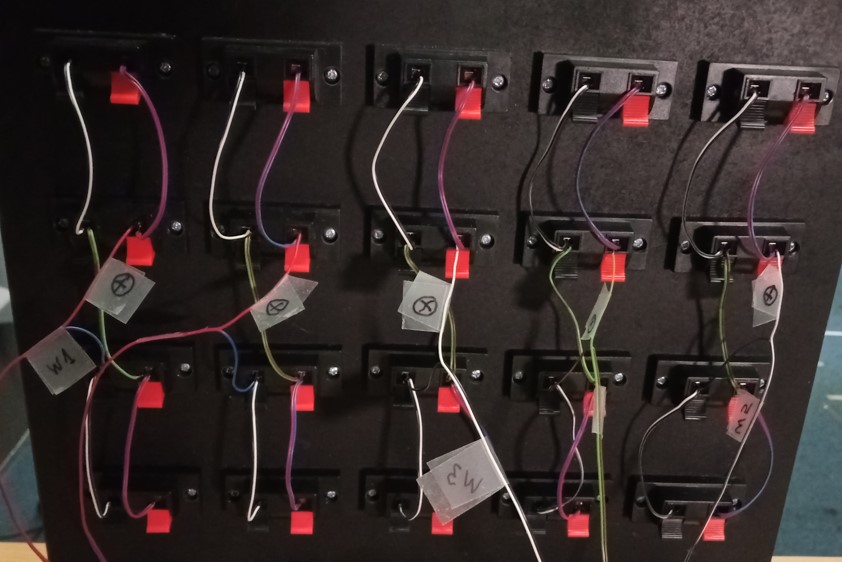
Fig. 108 Fragment of the loudspeaker array in the first version, divided into sections
The measurement results of the loudspeaker matrix coincide with the results obtained for the line source. This confirms the theoretical assumptions that in the case of loudspeaker arrays, adding loudspeakers vertically does not affect the directional characteristics measured in the horizontal plane, only the measured sound pressure level increases due to the larger number of transducers emitting the acoustic wave into the surroundings.
Similarly to the first version matrix, measurements of the directional characteristics of the second version matrix were made. In this case, it was not possible to use different variants of connecting the transducers to the amplifiers' output, because the power amplifiers and speakers are inseparable factory sets and it was decided not to interfere with their internal structures.
The influence of delay in the loudspeaker array components on the sound field distribution
The measurements examined the influence of the delay in the paths of processing and emitting signals in directional sources on their directionality and, therefore, the distribution of the acoustic field associated with them. The following part of the description presents sample measurement results of the loudspeaker matrix in the first version equipped with digital delay lines. As in the previous cases, the measurements were made using the Clio system and the results were based on FFT analysis. Fig. 112 and Fig. 113 show the first version of the loudspeaker matrix prepared for measurements. The measurements used digital delay systems in which the delay value is adjusted using multi-turn potentiometers. This approach was chosen due to the fact that the resolution of digital potentiometers in the measurement range for signals above 500 Hz was too low.
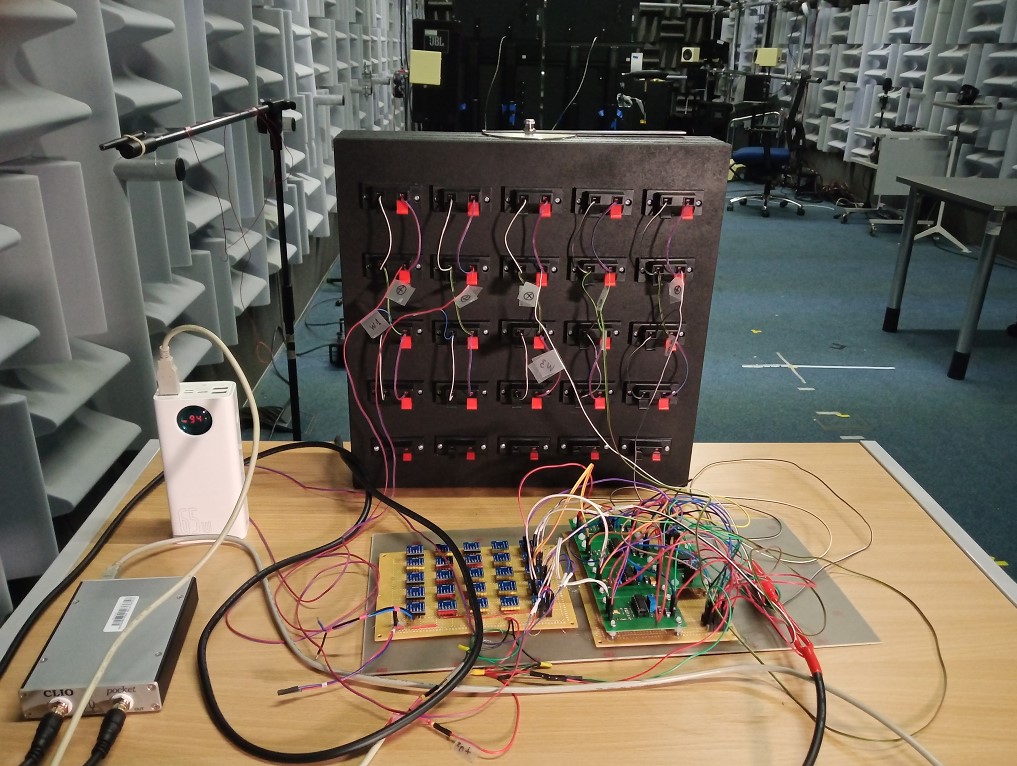
Fig. 112 The second version of the loudspeaker matrix prepared for measurements
Fig. 113 shows a front view of the loudspeaker matrix in the first version and the measurement microphone of the Clio system. At the top of the matrix there is a device for measuring the angle of the microphone relative to the central point of the matrix. The microphone is positioned at the height of the third row of matrix speakers.
When determining the radiation measurement angle, the angle between the device located on the upper wall of the matrix and the additional horizontal mounting parallel to the measuring microphone arm located at the height of the upper wall of the matrix was determined. Once the angle was determined, this additional element was removed so as not to interfere with the measurement.
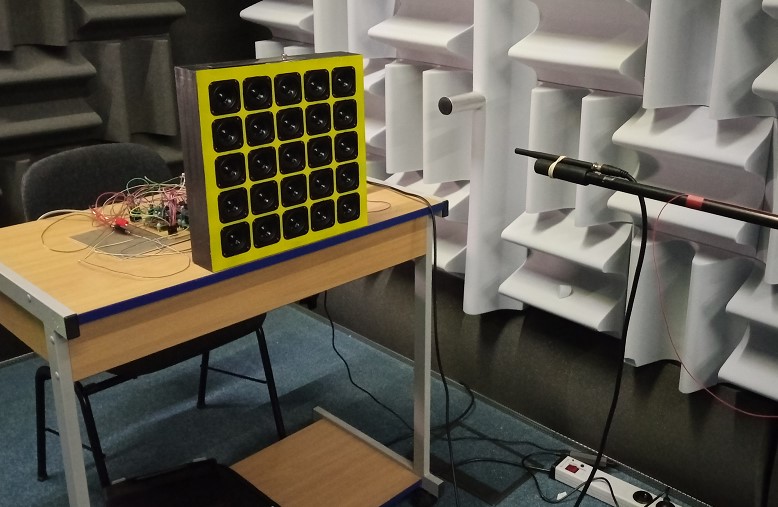
Fig. 113 Loudspeaker matrix in the first version prepared for measurements
Fig. 114 shows a fragment of the matrix containing a digital signal delay circuit board, the output of which is connected to the input of one of the power amplifiers controlling the loudspeaker of the matrix of the directional source being tested.
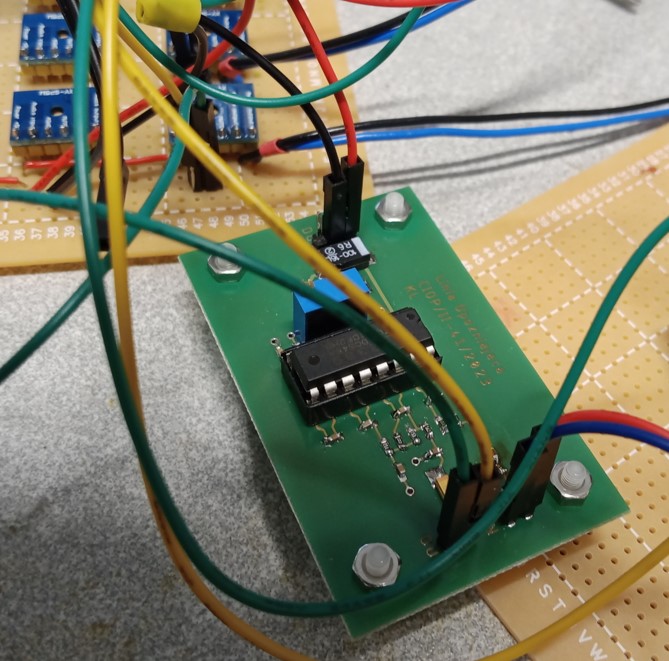
Fig. 114 One matrix channel including a digital delay circuit connected to one of the power amplifiers
The first measurement concerned a signal with a frequency of 250 Hz measured on the main axis of the source. In the case when the relative differences in the delay value between the loudspeakers are equal to zero, the value of the sound pressure level when the directional source is excited with a signal with an amplitude of 0.1 V is 76.7 dB.
The measured values are shown graphically in Fig. 115. The highest sound pressure level reduction value is 6.4 dB and is obtained using section number 4.
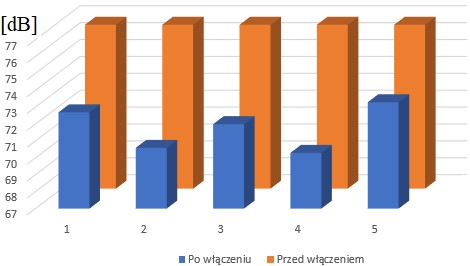
Fig. 115 Comparison of the values of the reduced sound pressure levels of the 250 Hz signal
In the case of higher frequencies (above 500 Hz), it is difficult to perform measurements in the available conditions, although the effect of the change associated with the delay value is audible. The mentioned difficulty is related to small delay values affecting changes in the sound pressure level. These small changes in delay are caused by small values of the acoustic wave length, the smaller the higher its frequency.
Below are sample measurement results for a sine wave signal with a frequency of 1 kHz and a type two loudspeaker array with loudspeakers connected to form five vertical sections. Similarly to the previously described measurements, the tests were performed using the Clio system. The measurement microphone was placed at a distance of 1 meter on the matrix axis. The signal had an amplitude of 0.1 V.
With no mutual phase shifts (potentiometers in the digital signal delay systems in all channels in the same position), the sound pressure level was 76.7 dB. Changing the delay value of the selected extreme (first or fifth) channel of the matrix made it possible to change the sound pressure level measured in its main axis in the range of 74.7 - 79.4 dB. As you can see, it is possible to reduce the sound pressure level by 2 dB or increase it by 2.7 dB.
From the point of view of practical applications, the difference between the maximum and minimum value is important, which in this case is 4.7 dB. If one of the extreme channels, e.g. the first channel of the source, is tuned in such a way that the value of the sound pressure level on the main axis is minimal, i.e. 74.7 dB, it can be further reduced using the neighboring channel (second or fourth) to value 66.8 dB. It was not possible to further reduce the sound pressure level on the main axis. This resembles the situation described earlier for signals with frequencies of 250 Hz and 500 Hz.
The ability to control sound field parameters in the frequency range up to 500 Hz may have great practical applications, e.g. in shaping the sound field, especially in relation to low-frequency noise.
As part of the research, a number of measurements were made of the impact of the delay values introduced in individual sections of the matrix, not only on the reduction of the acoustic pressure level in the selected direction of signal radiation, but also on its directional characteristics. Below are examples of measurement results of directional characteristics for a signal with a frequency of 500 Hz in the case when the values of the extreme delays of two matrix sections are set in such a way as to obtain the maximum reduction of the sound pressure level on the main axis of the matrix, i.e. to ensure that the acoustic field distribution is the smallest on the main axis.
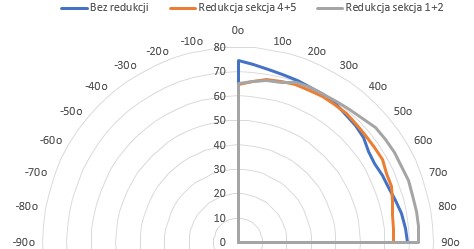
Fig. 127 A fragment of the family of matrix directional characteristics in the area of sections from number 3 to 5.
Fig. 127 shows a fragment of the set of directional characteristics of the matrix measured from the main axis at an angle of up to 90 degrees towards the loudspeaker section number 5. Of course, the directional characteristics of the matrix without the reduction related to the delays introduced by sections 1+2 and independently sections number 3+ 4 is symmetrical. In the case of controlling the matrix parameters using section delays, the directional characteristics are not symmetrical, as illustrated in Fig. 127.
The measurement results show that when reducing the sound pressure level using a matrix section on a selected side, it is possible to reduce the sound pressure level in the area on the same side as the selected matrix sections. On the side opposite to the main axis of the matrix, with an increase in the radiation angle, the sound pressure level may exceed the level before the level reduction operation on the main axis of the matrix. The value of reducing the sound pressure level on the main axis itself can be significant - in this case, almost 10 dB.
")
")
")
")
")